
When you’re running or managing a webshop, it can be hard to identify which products are hardest or easiest to sell. Reports like Google Analytics’ Enhanced Ecommerce show you buy-to-detail and cart-to-detail rates, that give you an indication of how many people see a product, add it to the cart and buy it. But it’s harder to tell how many products got left behind between the cart and the purchase.
Bring in the Robr metrics
The Robr metrics are here to help. It started out as a spin on ROAS (Return On Ad Spend) that focused on the potential basket revenue, or Return On Basket Revenue (ROBR or Robr). The goal of a Robr metric is to easily identify how many products the checkout process ‘robs’ from your cart.
Setting up Robr metrics
The Robr metric can be used in every data set, as long as it contains product cart quantity and product purchase quantity. If you’re using Google Analytics Enhanced Ecommerce, you’re in luck. There are two metrics you can easily set up in Google Analytics using calculated metrics [beta]:
1: Robr quantity
Metric one will show you how many products dropped out between your cart and your purchase page. Use this metric to identify the products with the highest number of dropouts. The formula is quantity of products in cart – quantity products in purchases.
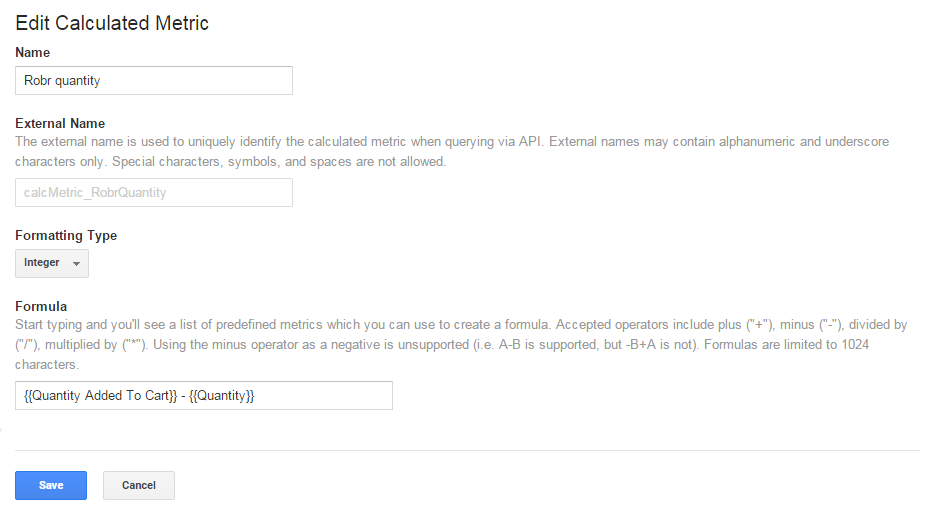
Robr quantity setup in Google Analytics.
2: Robr rate
Metric two will show you how big the percentage of the Robr quantity is compared to the quantity in the cart. The formula is: (quantity products in cart – quantity products in purchases)/ quantity products in cart.
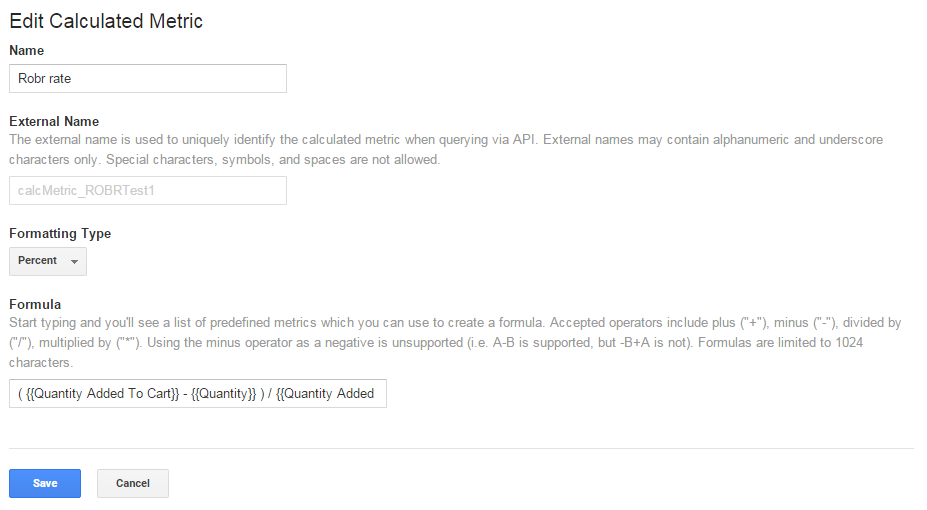
Robr rate setup in Google Analytics. Note that you can’t use a calculated metric within a second calculated metric. If it would be possible, (quantity products in cart – quantity products in purchases) would be metric 1: Robr quantity.
Keep in mind that these metrics only focus on quantity. It’s possible to add revenue into the mix, showing you the lost revenue between the basket and the purchase page. The calculation would be product revenue / (quantity products in purchases/quantity products in cart).
Using Robr metrics for analysis
The great thing about working at an online marketing agency, is that I can instantly discuss a metric idea with potential users such as marketers or our A/B testing team. Two examples that I got out these discussions:
1: Do upsell products have a negative impact on products in your basket?
When analysing upsell options in your basket, it may be hard to identify the effect. For example: if you sell books, and you want to upsell a second (cheaper) book in the checkout as a complementary product. You can look at the effect on both products, but to get the effect on cart dropouts of a product, you’ll need to do some manual analysis. With Robr rate, you can instantly see if the rate has changed for either product. In other words: does your upsell have negative impact on the products the user already has in their basket?
2: What products are a good fit for product recommendation?
If your shop has a suggested products part, you’ll want to suggest products that are both relevant and easy buys. The Robr rate will tell you if a product is likely to be bought as soon as it’s in the cart. This also works for content sites (such as our own). For a related posts part, you’ll want a mix of articles that are relevant, but also easy to read.
An example from our site
To give you an example, here’s an overview of this December’s article size data from our site:
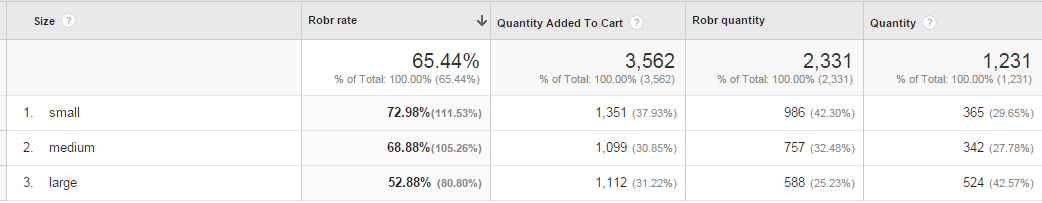
Google Analytics Custom Report from The Marketing Technologist. Dimension: Size. Metrics: Robr rate, Quantity added to cart, Robr quantity, Quantity.
This report shows us that the articles have an average Robr rate of 65,44%. It’s surprising to see that large articles have the lowest Robr rate. So our large articles are most likely to be fully read. You might expect that this would be the small ones, as there is less content to read. This is clear indication that the larger our articles get, the better the content seems to work.
Start using Robr metrics
This post gives some examples of the Robr rate for:
- easier analysis on upsell impact; and
- powerful input for recommendations systems for both shops and blogs.
Though the examples are focused on Google Analytics, the metrics are useful in each data set that contains the right data (cart quantity and purchase quantity).


Leave a Reply
You must be logged in to post a comment.